A model-driven app consists of several components that you select by using the App Designer. Components and component properties become the metadata. Let’s look more closely at these components.
Model-driven app components
Data
The table shows the different data components that can make up a model-driven app, which can determine what data the app is based upon.Expand table
| Component | Description |
|---|---|
| Table | Tables are items with properties that you track. Examples include contacts and accounts. Many standard tables are available. You can customize a nonsystem standard table (or production table). You can also create a custom table from scratch. |
| Column | Columns are properties that are associated with a table and help define that table. A column is defined by a data type, which determines the type of data that can be entered or selected. Examples of data types include text, number, date and time, currency, and lookup (which creates a relationship with another table). Columns are typically used in forms, views, and searches. |
| Relationship | Relationships define how tables can be related to each other. There are 1:N (one-to-many), N:1 (many-to-one), and N:N (many-to-many) relationships. For example, adding a lookup column to a table creates a new 1:N relationship between the two tables and lets you add that lookup column to a form. |
| Choice | This type of column shows a control that lets the user select among predefined options. Each option has a number value and a label. Choice columns can require either a single value or multiple values. |
User interface
The table shows the user interface components, which determine how users interact with the app and what designer is used to create or edit the component.Expand table
| Component | Description |
|---|---|
| App | Apps determine the app fundamentals, like components, properties, the client type, and the URL. |
| Site map | A site map specifies the navigation for your app. |
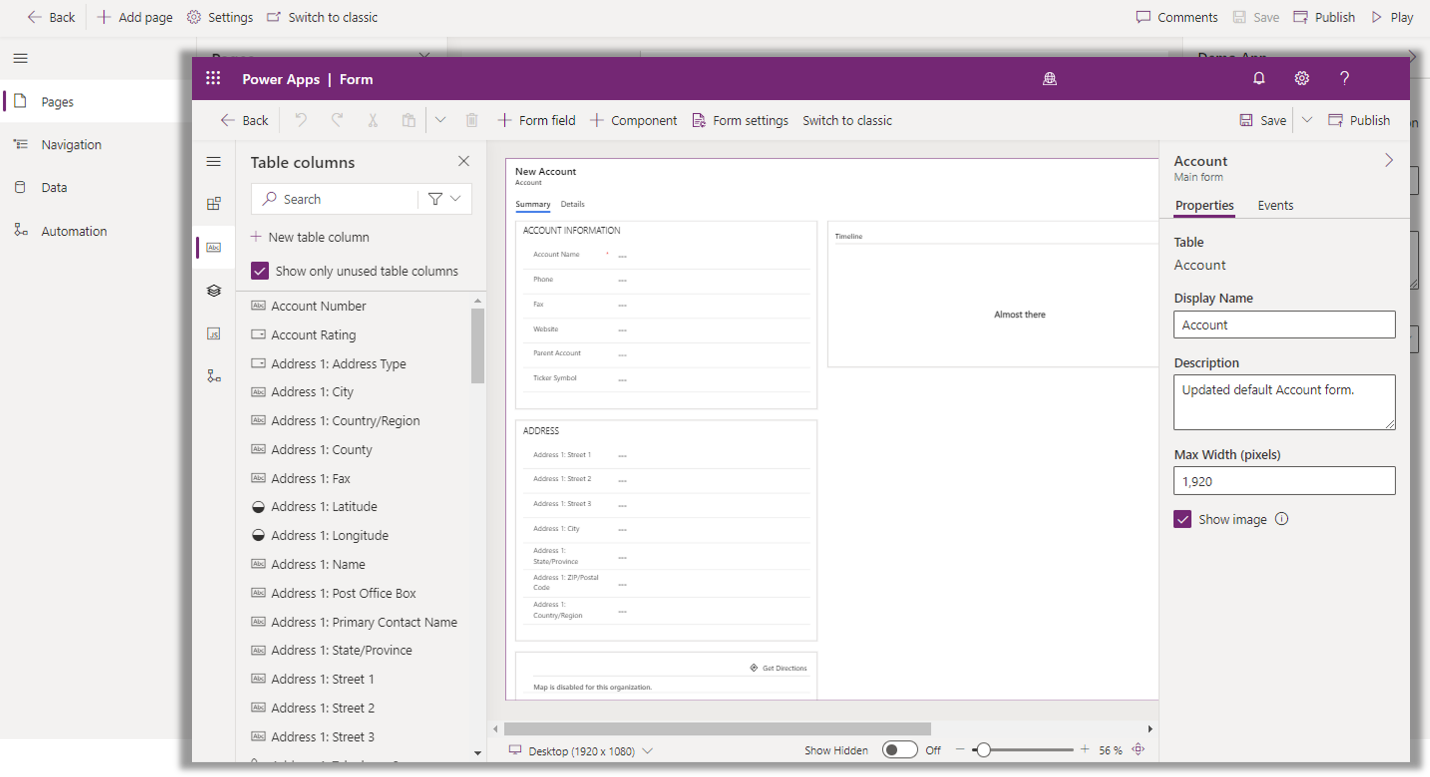
| Form | Forms include a set of data entry columns for a given table. A form can be used to create a new data row or edit an existing one. |
| View | Views define how a list of rows for a specific table appears in your app. A view defines the columns shown, the width of each column, the sorting behavior, and the default filters. |
Logic
The logic components determine what business processes, rules, and automation the app has. Microsoft Power Apps makers use a designer that is specific to the type of process or rule they need.Expand table
| Type of logic | Description |
|---|---|
| Business process flow | Business process flows walk users through a standard business process. Use a business process flow if you want everyone to handle customer service requests the same way. Or you can use a business process flow to require staff to gain approval for an invoice before submitting an order. |
| Business rule | Business rules apply rules or recommendation logic to a form to set field requirements, hide or show fields, validate data, and more. App designers use a simple interface to implement and maintain fast-changing and commonly used rules. |
| Flows | Power Automate is a cloud-based service that lets you create automated workflows between apps and services to get notifications, sync files, collect data, and more. |
Visualization
The visualization components determine what type of data and reporting the app shows and which designer is used to create or edit that component.Expand table
| Component | Description |
|---|---|
| Chart | Charts are individual graphical visualizations that can appear in a view or a form or that can be added to a dashboard. |
| Dashboard | Dashboards show one or more graphical visualizations in one place that provide an overview of actionable business data. |
| Embedded Microsoft Power BI | Power BI adds embedded Power BI tiles and dashboards to your app. Power BI is a cloud-based service that provides business intelligence (BI) insight. |
Some examples of visualizations in a model-driven app:

Building model-driven apps
Model-driven apps are built using the App designer. It’s a simplified user interface that allows you to specify which tables the app is based on and which visual elements should be included. Let’s look at the App Designer for one of the available sample model-driven apps called “Fundraiser.”